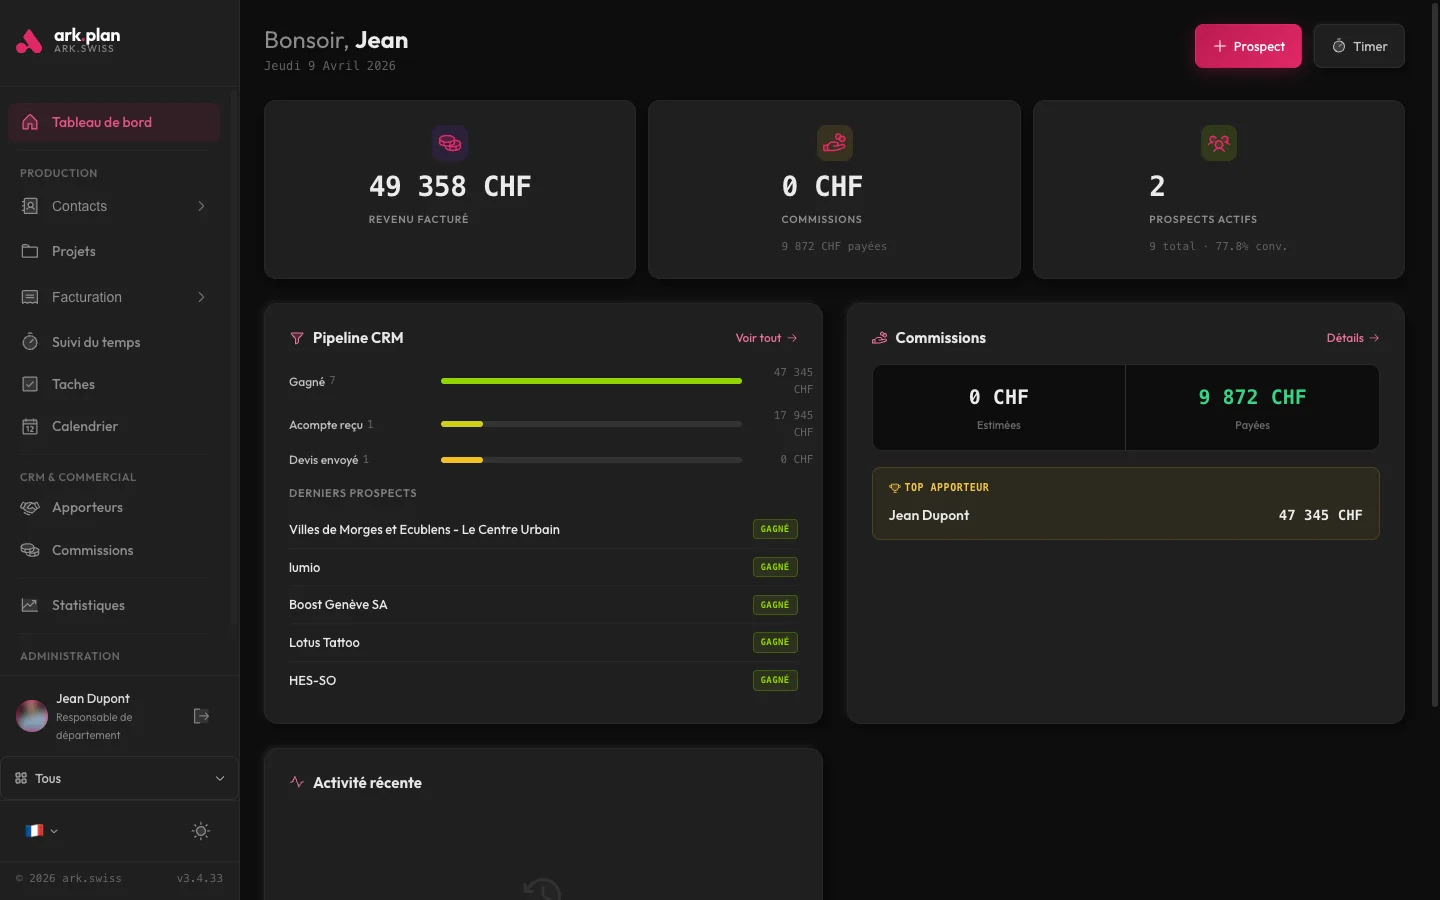
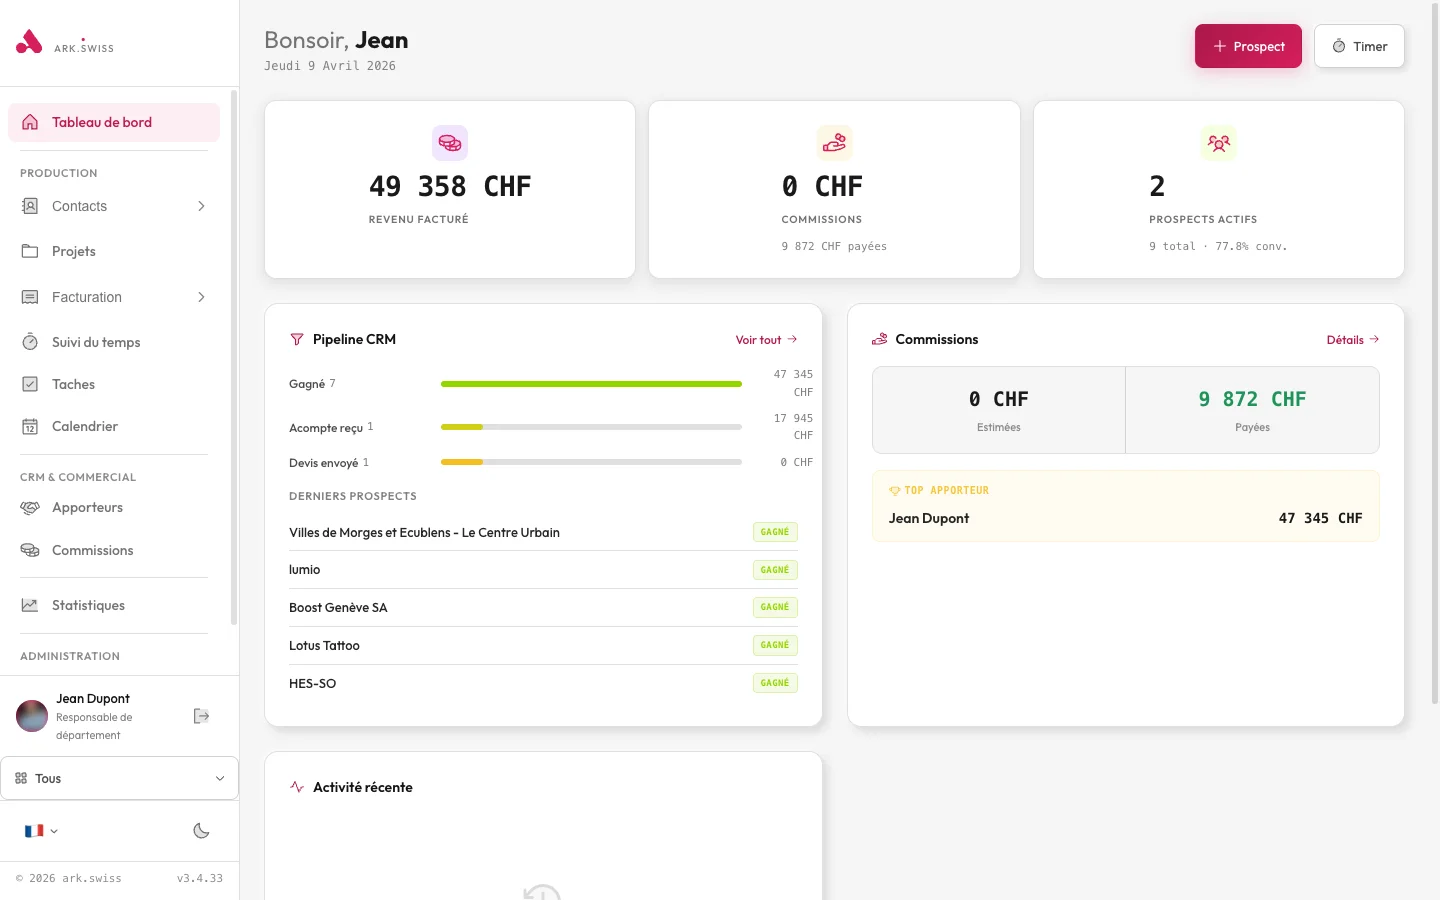
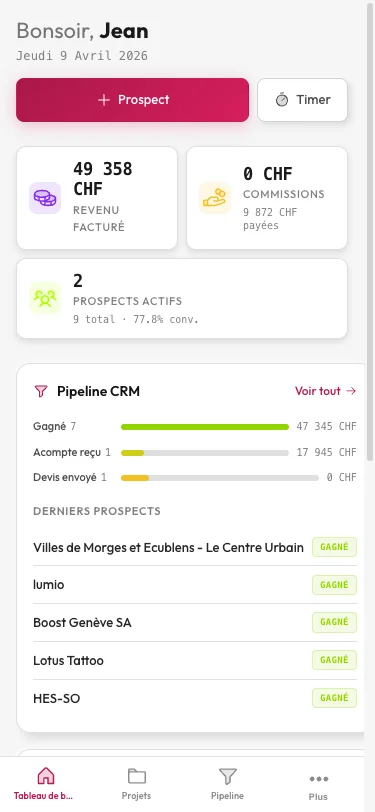
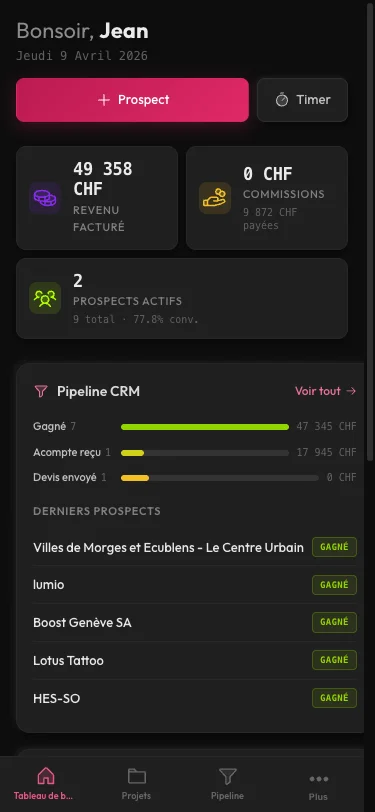
Your data talks — ark.plan translates.
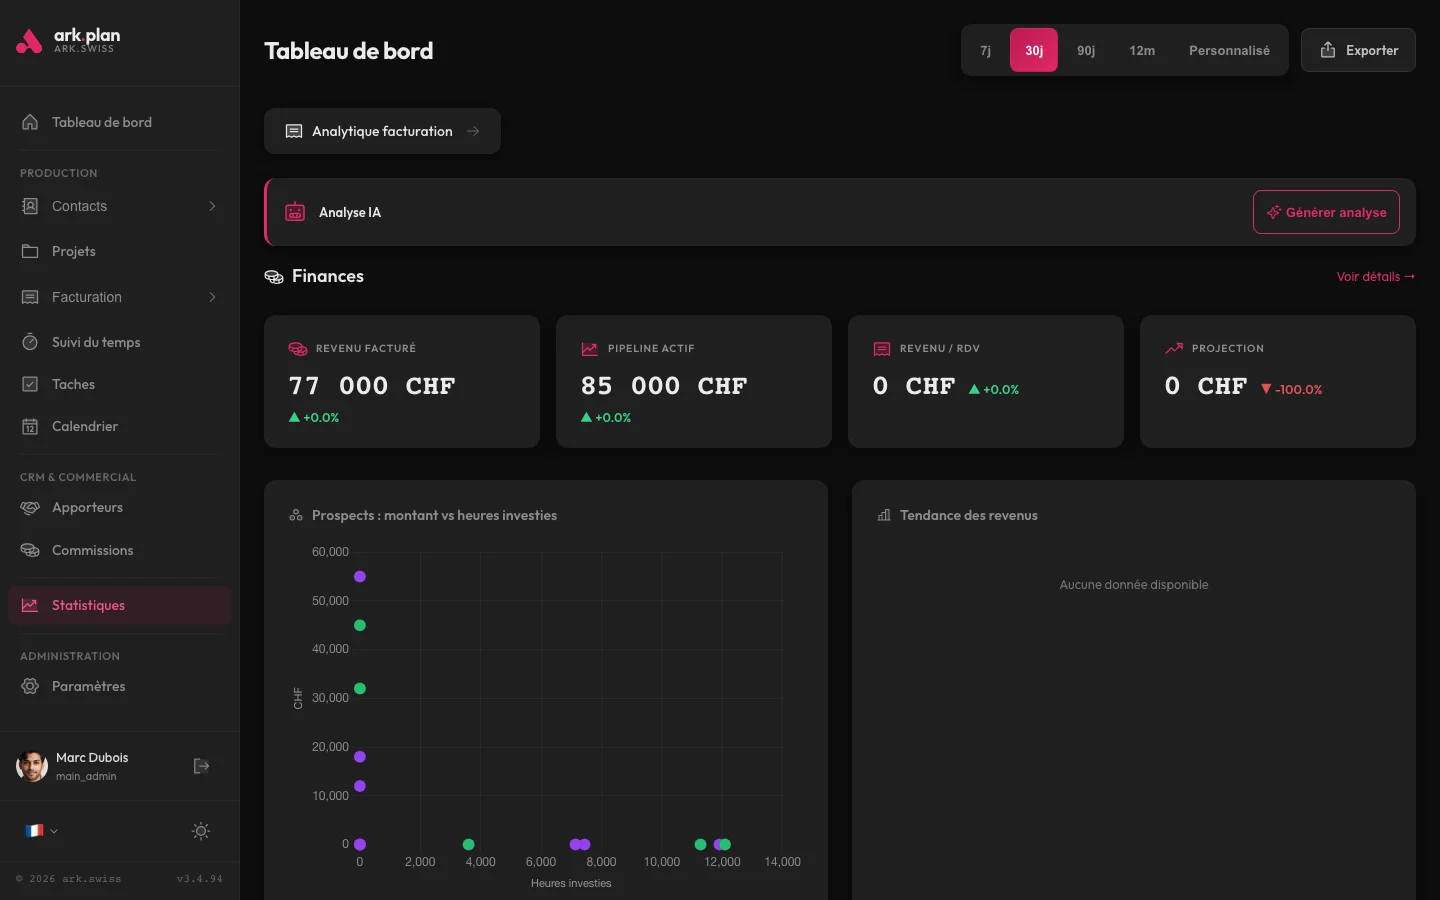
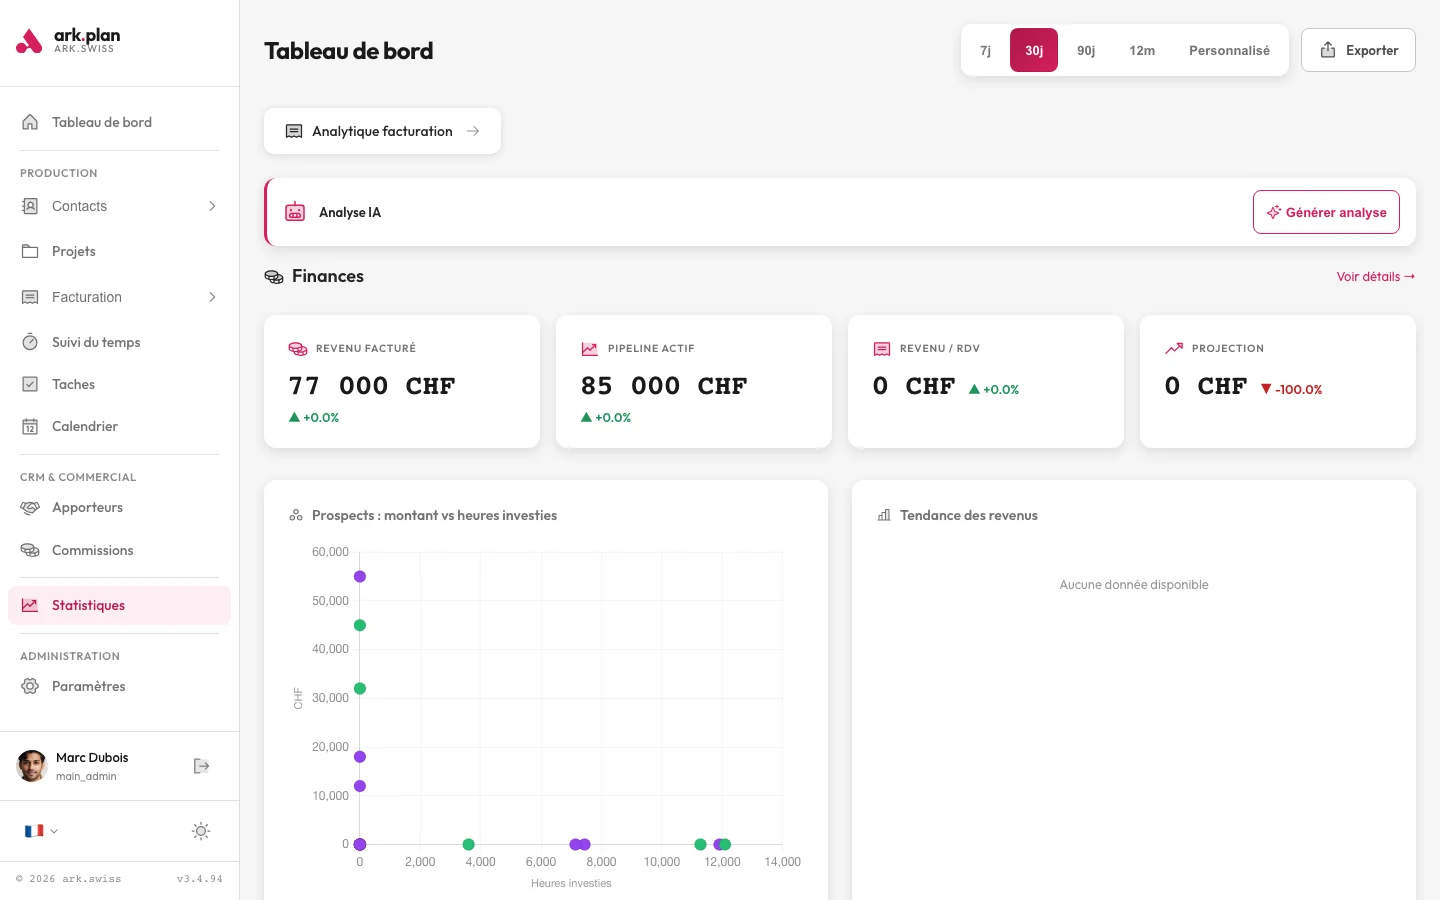
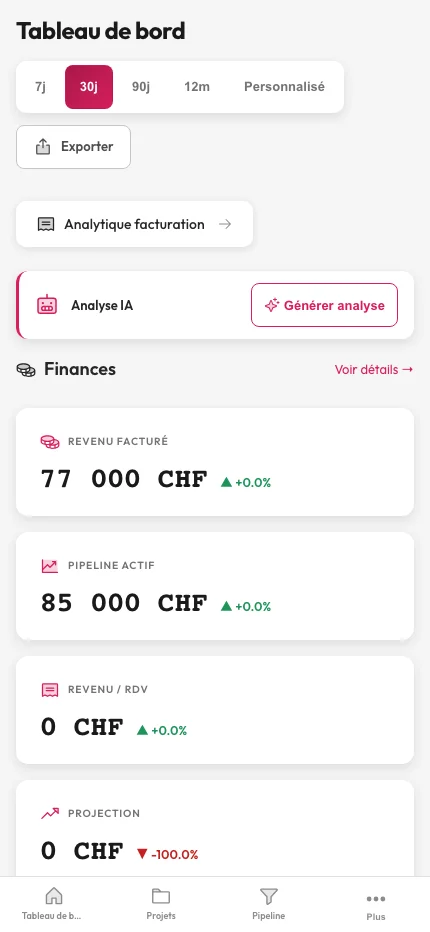
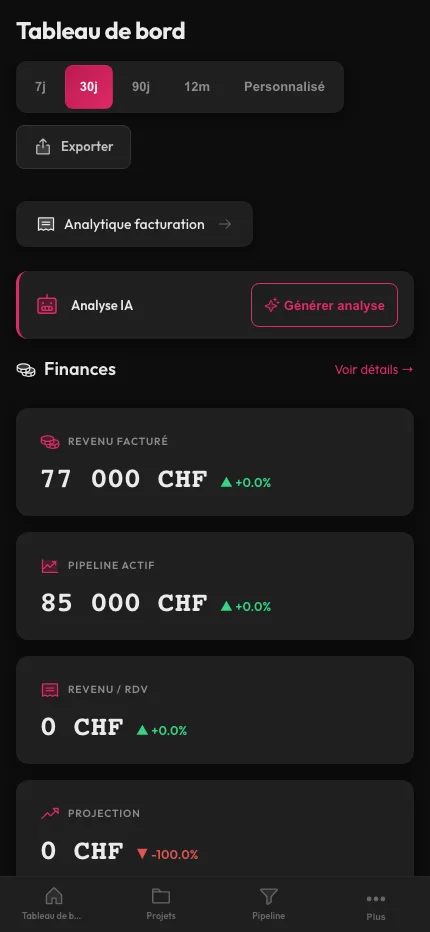
Overview, heatmap, funnel, trends — on one page.
The statistics dashboard aggregates: month vs previous month appointments, total prospects, CRM conversion rate, hours tracked, monthly revenue. Heatmap of appointment distribution by day of week and time slot. Visual CRM funnel with stage-to-stage conversion rates. Sparklines (mini-graphs) for each metric. Period comparison (this month vs previous vs same month last year).
- Core KPIs: appointments, prospects, conversion, revenue, hours
- Appointments heatmap day × hour
- CRM funnel with per-stage conversion rate
- Period comparison and sparklines
Insights generated automatically on your data.
In one click, ark.plan analyzes your metrics and produces textual insights: detected trends, anomalies to investigate, cohorts behaving differently, cross-module correlations. No tables to interpret — a natural language readout telling you what deserves your attention.
- On-demand AI insights generation
- Anomaly alerts: overdue invoices, forgotten appointments, budget overruns
- Cross-module analysis (CRM × invoicing × time)
- Scheduled reports emailed (cron)
Revenue, payment delays, client cohorts.
Dedicated finance view: revenue by period, outstanding and overdue invoices, average payment delay per client, average client value, estimated churn rate. Cohort analysis to see how clients acquired at time T behave over time. CSV export of all metrics.
- Revenue by period, outstanding and overdue invoices
- Average client value and estimated churn
- Cohort analysis
- CSV export of all metrics
Statistics
This module is included from the Pro plan.
Frequently asked questions
2 frequently asked questions. Can’t find an answer? Write to us — we reply within 24 h.
-
What is the difference between basic and advanced Statistics?
The Pro plan includes the basic dashboard: KPIs, heatmap, funnel, trends, revenue by period, top clients. The Business plan adds advanced statistics: quote → invoice conversion, per-project profitability, average payment delays, cohort analysis, AI insights and scheduled reports. -
Can I export raw data?
Yes. All metrics can be exported as CSV for use in your analytics tool of choice (Tableau, Metabase, Excel, Looker Studio).
Ready to give it a try?
First month free. No charge before day 30. Cancel in one click.
- First month free
- No charge for 30 days
- No commitment
- Cancel anytime